Do you produce search marketing reports for clients? Many agencies and Internet marketers deliver a summary of performance for PPC and SEO on a weekly or monthly basis, but who decides what data goes into these reports, what metrics to include, and which graph to use to visualize the data?
Remember the Dunkin’ Donuts commercial, “Time to Make the Donuts”?
This is how most search marketers feel in the beginning of each month. “Time to make the search marketing reports.”
Monthly reporting is necessary to keep clients happy, but what you put in these reports is even more important. Even the easiest client in the world wants to see what is going on if they are paying you money to manage a marketing campaign.
Clients are unique and different, from B2C to B2B to e-commerce and lead generation, but the reporting process is usually very similar. Depending on what campaigns you are managing data for, reporting will be used from Google Analytics, AdWords, Bing/Yahoo, Facebook, Twitter, email, etc.
If your client is e-commerce, you can get revenue from most of these data sources, but if your client is B2B with sales over the phone or offline, this creates a common reporting challenge. Read this post about Google’s new free Call conversion tracking if you need to measure call conversions.
Goals, Budget, and KPIs for Measuring Success and Failure
Before working with a client, or at least before the campaigns are started, the goals and key performance indicators (KPIs) should be defined and agreed. How you decide to report these KPIs is up to you, but not agreeing and documenting that before you start will cost you clients, especially if performance drops.
This post will share the eight metrics clients will actually want to see for each marketing channel you are managing. After 15 years of providing search marketing services and more than 5,000 monthly reports, these are the most commonly requested and actionable metrics clients care about.
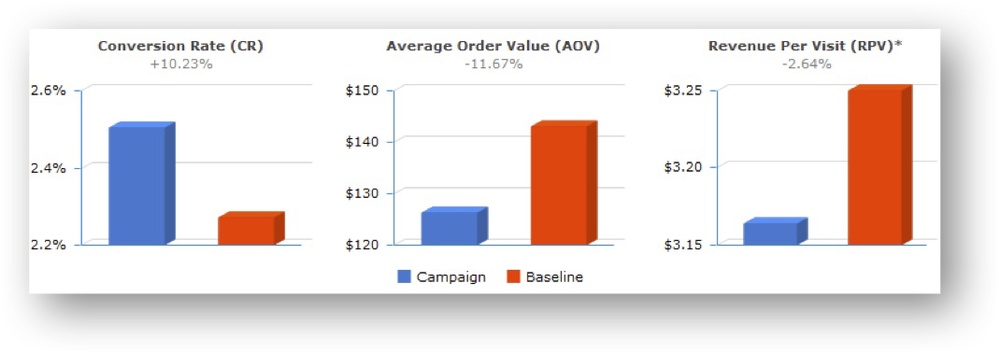
1. Revenue, Sales, Revenue per Visitor (RPV), Average Order Value (AOV)
The most important data you can share with a client is revenue- and conversion-focused. In a perfect world we would just report return on investment (ROI) or profit per campaign and decision making would be easy.
At the end of the day, if you can’t prove more revenue is coming in than going out, you will ultimately get fired. Determine the most accurate source to collect revenue from the client. Will you be given access to pull this data automatically or have someone send you the information?
I used to only require a client to give me the revenue generated from SEO or PPC. This is definitely something you should do, but it’s also good to ask for the total company revenue to get a sense of the financial health of the client. Web analytics shows us immediate data to measure results, but with multichannel attribution, multidevice, and human error, it is important you see the whole picture before reporting or making any decisions.
My favorite metric for measuring marketing and campaign performance is revenue per visitor (RPV).
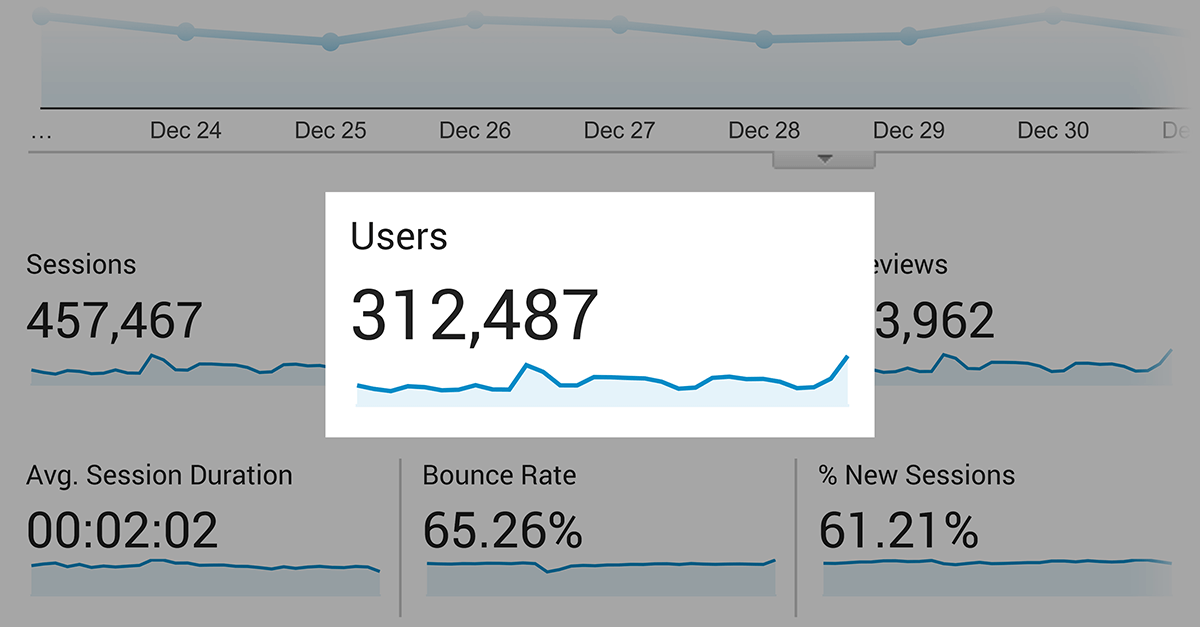
2. Visitors, Clicks, Sessions, Traffic
It doesn’t matter what you call it, but if you are hired for PPC or SEO, this metric better increase. Step one in driving more sales is to increase visitors to the website and this is a metric you will want to highlight in all your reporting. Are more people coming to the website and how much growth are we having month-over-month or year-over-year?
Visitor data is only as good as the segments and filter you apply. Just showing total traffic to a site as a whole doesn’t really help. I need to know which channel, campaign, brand vs. non-brand keywords, etc.
3. Spend on Clicks, Media, and Management Fee
In order to calculate performance, the client usually will subtract the PPC spend from the revenue generated to see if there is any profit. I’ve gone back and forth whether to show the results on just the media spend or include the total investment with the management fee.
Including the management fee obviously brings down the profit, but I believe that is the more honest way to report. Sometimes it might be worth showing both so they know these are the results they can expect on the media spend whether using you or not. If you were the CEO or client, you would make decisions based on the revenue generated minus total investment (spend + fee), so include it for them.
4. Profit, ROI, ROAS, CPA
If you want a long-term happy client, drive huge profit or ROI. I have kept clients over 10 years because the return on advertising spend is more than 1900 percent. Yes, that is almost 2000 percent ROAS. Why would they cancel? We raised the fee once, but everyone is happy so why rock the boat?
Being able to calculate profit or true ROI involves more work. You need to find out the average profit margin per sale and if there are several products or services this can get complicated quickly. At least agree on an average sale and average gross profit that you can use in your reporting.
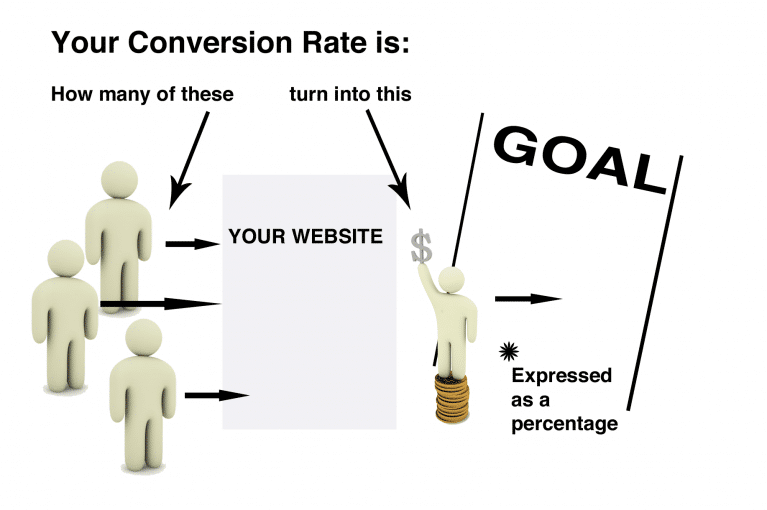
5. Conversion Rate Percentage
Unfortunately, sometimes even with the best PPC and SEO strategy, the campaign just isn’t performing. When this happens the only thing you can do is increase the conversion rate on the website or decrease the cost per click. Sometimes we don’t start the campaign until a client makes a few mission critical changes to the website for better usability and conversions.
Once you have a baseline conversion rate, you can begin testing images, headlines, buttons, colors, design, etc. One area you might not have thought to look when trying to figure out what to test is keyword research.
Beside revenue and profit, the conversion rate should be the focus in most reporting. It is the driving of results – if you can’t improve the conversion rate, your CPA and profit will never improve. Conversion rate is the perfect indicator of traffic quality, website usability, and how the client’s value proposition is performing.
6. Impressions, CTR, and CPC
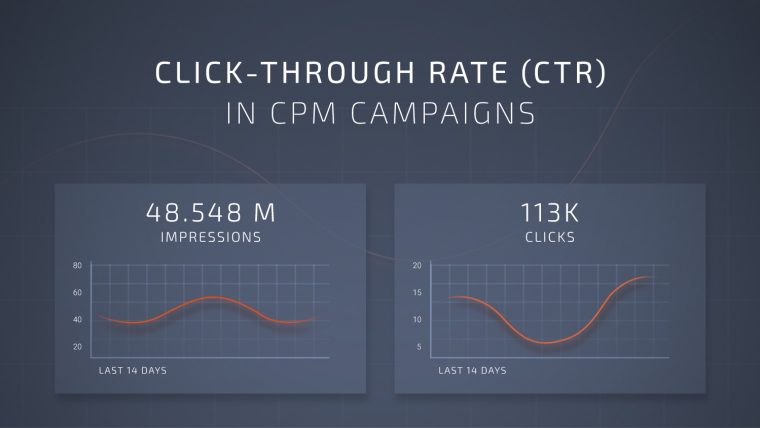
In the good old days, showing millions of impressions made you look amazing, but now times have changed. It is more a focus on how do these impressions perform when seeing your ads, which can be measured with the click-through rate (CTR).
In a last attempt to save the client if all other metrics don’t look good, at least prove your ad creative is getting better and your CTR is increasing, which usually brings down the CPC. “Mr. Client, we haven’t been able to hit the ROI goals or improve the conversion rate, but our ads are performing amazing and your cost to bring a visitor to your website is decreasing.”
7. Organic SEO Keyword Rank and Social Mentions
I’ve focused this post mainly on PPC metrics, but if you are doing SEO, a keyword ranking report is a must. I have started calling SEO (Social Engagement Optimization) because we are no longer optimizing for the search engines, we are optimizing content for people. And a lot of those people are on social networks, which can impact rankings. Keyword ranking reports were almost dead until Google started blocking keyword data. Now you have to use Webmaster Tools or ranking reports to determine which keywords are driving the traffic from organic SEO efforts.
Social media metrics are great, but in the end they should tie back to revenue, not just mentions.
8. Competitive Data and Advanced Metrics
Not doing competitive research with a keyword research and competitor spying tool described in this post, can cause you to inaccurately price your proposal. Understand the market, keywords, competitors, ads, and landing pages you are up against before estimating the hours to manage the PPC or SEO.
I require my clients to give me the top keywords and competitors that they think are important before doing a proposal. If they become a client I require them to share monthly revenue generated from these efforts so we can both have visibility into what is working or not working.
Some more sophisticated clients may want to dig into metrics at the keyword or device level. For example, day of the week, time of the day, geo location, and device can open big opportunities with your bid modification strategy.
Below is an example of a dashboard for paid search featuring spend, revenue, revenue per click, revenue per campaign, revenue per keyword, and conversion rate.
In Conclusion
The goal of reporting for agencies is to show results and prove value. Usually you are looking to deliver metrics that highlight positive results or trends. If you want another expert option on important metrics, here are 10 KPIs for marketers that you should consider including in your reporting.
In a perfect world, metrics tie back to the business goals and can be defined and easily measured. Metrics should not report meaningless averages, but instead appropriate segmentation must be set up so the client and agency have a clear view of how different types of visitors behave. The more segmentation you do the more actionable the data can be and the quicker the insights on specific traffic. Remember, always compare to a previous time period in your reporting because numbers without comparison or percentage change mean nothing.
By Jamie Smith
